
When it comes to evaluating your website’s loading speed, two popular tools often come into play: the inbuilt Lighthouse tool in browsers and the PageSpeed Insights website. Both tools are developed by Google and aim to provide insights into your website’s performance, but they operate differently and can yield slightly different results. Let’s delve into the specifics of each tool, their resource usage, server interactions, and why their results might vary.
Lighthouse: Browser-Based Performance Testing
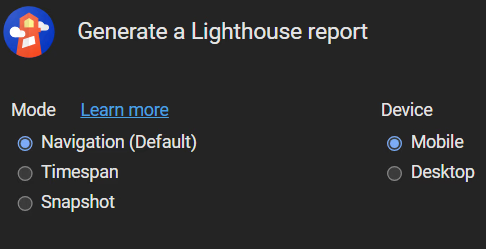
Lighthouse is an open-source, automated tool integrated into Chrome’s DevTools. It can be accessed directly from the browser, making it convenient for developers to run performance audits on their websites. Lighthouse evaluates various aspects of a web page, including performance, accessibility, SEO, and best practices.
Resource Usage: When you run Lighthouse from your browser, it uses your local machine’s resources. This includes CPU, memory, and network bandwidth. The tool simulates a slower network and device to mimic real-world conditions, which can be adjusted in the settings. This local execution means that the performance metrics are influenced by your machine’s capabilities and current load.
Server Interaction: Lighthouse makes requests to your server to load the web page, just like a regular user would. However, since it runs on your local machine, the server’s response times can be affected by your network conditions and the geographical distance between your machine and the server.
Results: Lighthouse provides lab data, which means it tests the page in a controlled environment. This data is consistent and repeatable, but it might not fully represent the real-world user experience. The results can vary based on the local machine’s performance and network conditions at the time of the test.
PageSpeed Insights: Web-Based Performance Testing
PageSpeed Insights (PSI) is a web-based tool that analyzes the performance of a web page using both lab and field data. The lab data is generated using Lighthouse, while the field data comes from the Chrome User Experience Report (CrUX), which collects real-world performance data from users who have opted in to share their browsing data.
Resource Usage: Since PSI runs on Google’s servers, it doesn’t use your local machine’s resources. Instead, it leverages Google’s infrastructure to simulate the page load. This ensures a consistent testing environment, unaffected by the user’s local machine or network conditions.
Server Interaction: PSI makes requests to your server from Google’s data centers. This means the server’s response times are measured from a consistent location, providing a more stable baseline for performance metrics. The field data component of PSI reflects real-world user experiences, capturing a variety of network conditions and device capabilities.
Results: PSI combines lab data from Lighthouse with field data from CrUX. The lab data provides a controlled, repeatable measure of performance, while the field data offers insights into how real users experience the site. This combination can give a more comprehensive view of performance but can also lead to discrepancies if the lab and field data differ significantly.
Why Results Can Differ
- Testing Environment: Lighthouse runs on your local machine, which can introduce variability based on your hardware and network conditions. PSI runs on Google’s servers, providing a more consistent testing environment.
- Data Sources: Lighthouse provides lab data only, while PSI combines lab data with field data. The field data reflects real-world user experiences, which can vary widely based on factors like device type, network speed, and geographic location.
- Network Throttling: Lighthouse uses simulated network throttling to mimic slower connections, which can be adjusted in the settings. PSI uses a standardized environment for lab data but also incorporates real-world network conditions in its field data.
- Geographical Differences: The location of the testing server can impact results. Lighthouse tests from your local machine, while PSI tests from Google’s data centers, which might be closer or farther from your server.
- User Variability: PSI’s field data captures a wide range of user experiences, including different devices, browsers, and network conditions. This can lead to more variability in the results compared to the controlled environment of Lighthouse.
In summary, while both Lighthouse and PageSpeed Insights are valuable tools for assessing website performance, they serve slightly different purposes and can produce different results due to their distinct testing environments and data sources. Lighthouse is ideal for controlled, repeatable tests during development, while PageSpeed Insights provides a broader view of real-world performance. Understanding these differences can help you make more informed decisions about optimizing your website for speed and user experience.